We have all been there, a customer calls in a bug on the production environment. The first thing we do is that we go to the log files and see if we can find the error. Sadly the developer who wrote the code did not think that anything could go wrong so, so he decided not to spend the time creating a meaningful error message, after all, what could possibly go wrong?… So we end up with a generic error message which does not show the root course of the error.
Luckily it’s not the first time that someone forgot to implemented logging, and as the skilled software developer we are, we go to the development environment and see if we can reproduce the error. After a long time spent, we give up and go to the production environment to check if the bug perhaps has magically disappeared. Hopefully, it is gone so we can tell the customer how hard the bug was to track down and how we manipulated single bits to make everything work again! Sadly the bug is still there…
Since we cannot reproduce the error in the development environment we now have two choices. The first choice is to implement more logging, but this requires us to restart the production server to get everything up and running again, and the customer does not like that idea.
The second choice is to start a remote debugging session and set a few breakpoint to see if we can figure out what is coursing the error, this approach means that the users on the production server cannot continue their workflow because the breakpoint stops the flow of the application, and the customer does not like that idea either. So we end up with two choices that the customer does not like.
Luckily at Microsoft Build 2017, Microsoft introduced the Visual Studio snapshot debugger. Visual Studio snapshot debugger enables us to debug the production server without affecting the users and collect error data showcasing the state of the application when the error was thrown.
In this blog post, I will introduce you to how it works, and how to setup Visual Studio snapshot debugger.
Introduction to snapshot debugger
Snapshot debugger enables us to automatically collect debug snapshots from live applications. The snapshots show the state of the application and variables at the moment when the error was thrown. The error can then be viewed on Azure Portal under the “Snapshot Debugger” tab.
Instead of having to go to Azure Portal every time to check up on our collected snapshots. It is possible to get a better experience by downloading the Visual Studio Snapshot Debugger extension for Visual Studio 2017 Enterprise. The extension enables the possibility of debugging snapshots in Visual Studio. It also enables us to set breakpoints directly in our source code and get real-time snapshots directly in Visual Studio without affecting the users on the site giving us the possibility of debugging live applications. Since I don’t have a Visual Studio Enterprise version I won’t be able to show you the features.
Note that if you’re running ASP.NET Core snapshot debugger is only available for ASP.NET Core Version 2.0 and newer.
Setting up Visual Studio snapshot debugger
Collecting snapshots requires setting up Application Insights. Setting up Application Insights is very easy. All you need is a Microsoft Account with Azure and a web-application either hosted in the cloud or on an IIS.
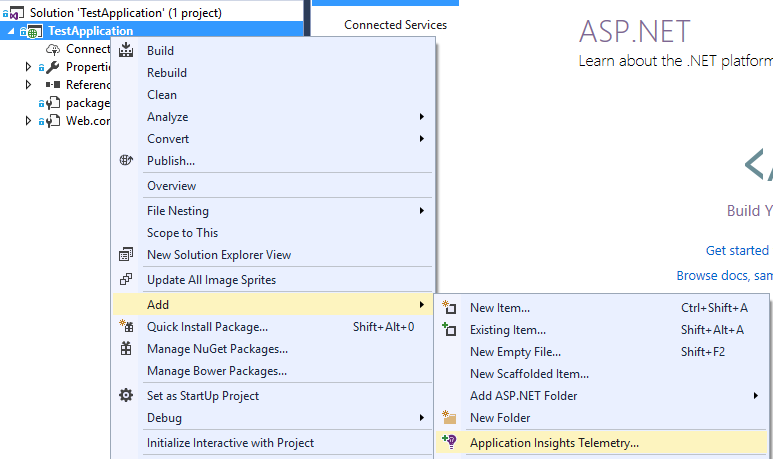
To use Application Insights in your project, just right click your project file click “add” and choose “Application Insights Telemetry”. After that is done you will be prompted with the setup of Application Insights, just follow the wizard and you will have Application Insights up and running in no time!
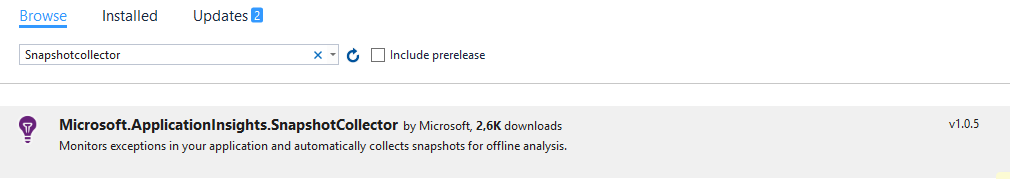
Next step is to include Microsoft.ApplicationInsights.SnapshotCollector NuGet package in your app. This can either be done from the NuGet package manager console typing the following command.
Install-Package Microsoft.ApplicationInsights.SnapshotCollector
Or getting it from the NuGet package manager interface.
After adding the SnapshotCollector package to your solution you ApplicationInsights.config file will now have the following XML added. In here you can config the way the snapshots should be collected.
<Add Type="Microsoft.ApplicationInsights.SnapshotCollector.SnapshotCollectorTelemetryProcessor, Microsoft.ApplicationInsights.SnapshotCollector">
    <!-- The default is true, but you can disable Snapshot Debugging by setting it to false -->
    <IsEnabled>true</IsEnabled>
    <!-- Snapshot Debugging is usually disabled in developer mode, but you can enable it by setting this to true. -->
    <!-- DeveloperMode is a property on the active TelemetryChannel. -->
    <IsEnabledInDeveloperMode>false</IsEnabledInDeveloperMode>
    <!-- How many times we need to see an exception before we ask for snapshots. -->
    <ThresholdForSnapshotting>5</ThresholdForSnapshotting>
    <!-- The maximum number of snapshots we collect for a single problem. -->
    <MaximumSnapshotsRequired>3</MaximumSnapshotsRequired>
    <!-- The maximum number of problems that we can be tracking at any time. -->
    <MaximumCollectionPlanSize>50</MaximumCollectionPlanSize>
    <!-- How often to reset problem counters. -->
    <ProblemCounterResetInterval>06:00:00</ProblemCounterResetInterval>
    <!-- The maximum number of snapshots allowed in one minute. -->
    <SnapshotsPerMinuteLimit>2</SnapshotsPerMinuteLimit>
    <!-- The maximum number of snapshots allowed per day. -->
    <SnapshotsPerDayLimit>50</SnapshotsPerDayLimit>
</Add>
After you have configured the ApplicationInsights.config file as to your liking, we are now ready to use the service. Remember to include PDB files on release build, else the snapshots you collect won’t be showing important data.
Snapshots
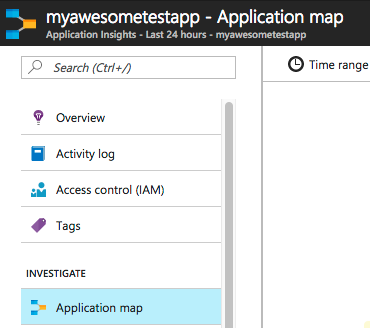
To study your snapshots go to Azure Portal and go and your Application Insights “App”. Click on Application map, in the left side menu.
Next, an application map will be shown containing all the resources of the application. Since this is a small app, only two resources are being shown.
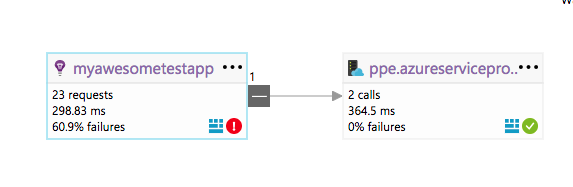
If we take a look at the “myawesometestapp” resource it shows that there have been errors in the application. I’ve manually added an error to be thrown every time the about page is being requested. Resulting in a “System.IndexOutOfRangeException” error being thrown. The snippet below shows the code that is the course of the error. As you can see the code is a masterpiece ;).
public ActionResult About(int arraySize)
{
    var array = new int[arraySize];
    array[5] = 10;

    return View();
}
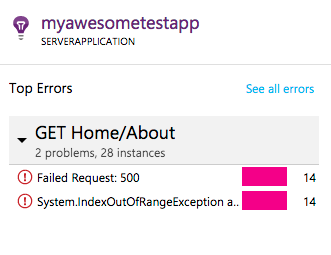
If we click on the “myawesometestapp” resource a new window to the right opens. The window contains the errors that the application has registered. We can see that two problems have occurred and been registered in total 28 times, 14 times each.
By clicking the “System.IndexOutOfRangeException” one. The following window opens. What we care about is the “Open Debug Snapshot” link.
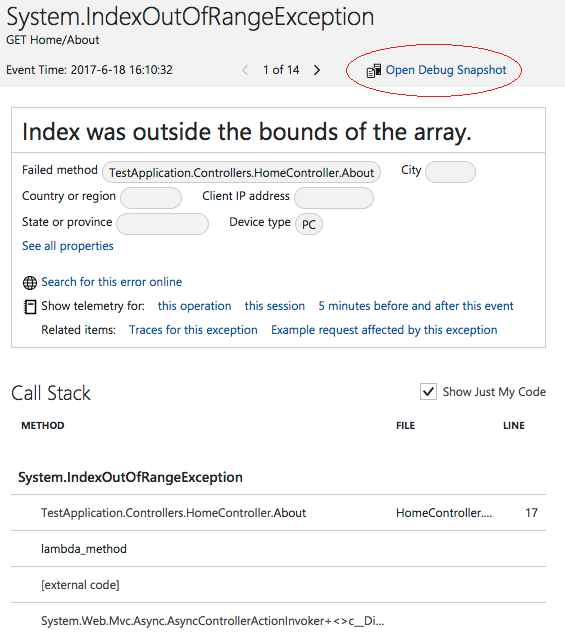
After clicking the “Open Debug Snapshot” a new window opens containing an “interactive” snapshot of the application state at the time where the exception was thrown. In there we can start looking, at what caused the problem.
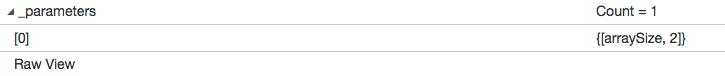
Using the information in the snapshot we can see that the arraySize that was passed to the “About” controller was the value of “2”.
Luckily the snapshot also collected a better error message than what was shown in the stack trace, helping us to figure out what went wrong.

Before you get too excited about this, remember that snapshot does not automatically tell you what went wrong, sometimes you will find that the snapshot does not contain any information that can help you in figuring out what is causing the problem.
Enterprise Visual Studio
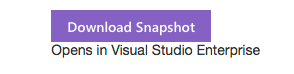
If you want a better experience debugging instead of looking, at all of the data in the snapshot, it is possible to download the snapshot and do a “playback” of the exception. The button can be found in the top right corner of the Debug Snapshot section. I won’t be able to show this feature in the post since I don’t own Visual Studio Enterprise.
Having enterprise Visual Studio also enables the possibility of debugging live and taking a snapshot by setting breakpoint without affecting the users.